In the U.S., today is election day. Whatever one’s political leanings, the governing structure of the U.S. is based on participation, so we go out and vote. We biked to vote today, how about you?
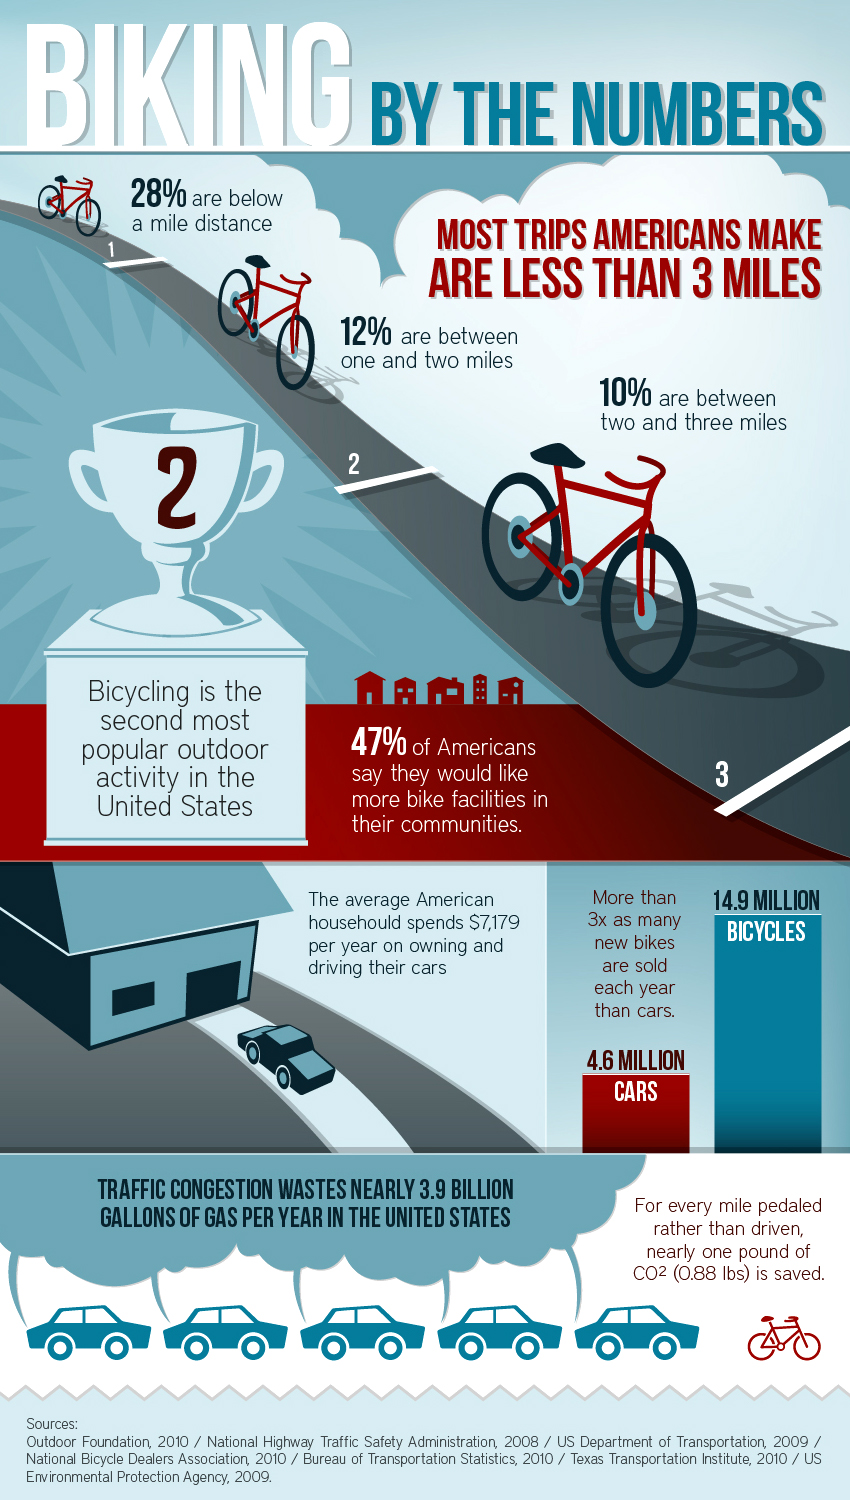
Unless you vote by absentee ballot, you’ll probably find yourself headed off to a neighboring school, fire station, or other public building to vote. Often these are not that far from where we live, so why not bike? As the infographic shows, many of our trips are rather less than 3 miles, so don’t worry about parking and bike to vote!
Bikes Belong released and publicized the data that this infographic is based on, and besides providing a little motivation to bike to vote perhaps it will shed a little light on other great reasons to bike commute.


I walked to the polls. Then continued to lunch and short walk around town voting at all the polling places along the way. Vote Early – Vote Often
Good factual support here for a great cause. One could also throw in the improved health and fitness or regular bikers. A question: is the $7179 average annual car cost per vehicle or the average # of vehicles owned by the average American household?
Keep up the good work!
Thanks for the thoughtful observations. According to what Bikes Belong has published, the monetary figure is the average amount an American household spends on owning and maintaining their cars. So this average would have been derived from a data set with figures as wide ranging as a single vehicle household to those with multiple vehicles – also those with new and/or used vehicles. A local area writer put together this info-graphic about her own household economic transformation when switching to cycling.